Over their career, the Grateful dead played some 2,318 shows. Each of them is unique. Most fortunately, a majority of them were recorded for posterity.
My ambition is to create new shows using machine learning. That is, entire new shows that, to the listener, are indistinguishable from the real thing, except they will be created inside a computer.
Since this somewhat of a non-trivial task, we’ll start this blog with a little explanation of the method we will start with. To first note, getting a whole show is a serious piece of work. I’m going start by reducing this to a slightly different task: produce 10 seconds of audio that sounds like the Grateful Dead.
So, how do we even do that? The answer lies in deep convolutional generative adversarial networks (DCGAN). Big words, but we can break them down.
To make a DCGAN, we need two pieces. the first piece is a discriminator. You give it a piece of music, and it tries to answer a question: Is this music Grateful Dead? This discriminator is trained using machine learning techniques: we give it two large sets of data (lots of Grateful Dead ten second snippets, and lots of non-Grateful Dead ten second audio snippets) and let it learn to tell the difference.
The other part is the creator. This is a device that learns to create Grateful Dead audio. It does this by trying to beat the discriminator. When the learning is started, the discriminator is really bad at telling the difference between the two sets of audio, and so the creator can easily fool it. As the discriminator improves by learning, so should the creator.
Sounds Simple!
If only. The main problem is the data. DCGANS have proven to be very successful with images. As an example of this, go and look at some images of humans generated using this method: https://thispersondoesnotexist.com/. I hope you’ll agree that’s quite impressive. However, experiments with raw audio have NOT been successful, so to start with our experiments will be with images, NOT audio. However, we will use a very special kind of image: a Mel Spectrograph.
Mel Spectrograms
A Mel Spectrogram is essentially a special kind of graph. The horizontal axis represents time, whilst the vertical axis represents frequency: finally, the volume is given by the colour. it’s easier to look at one to understand it. Here’s a Mel of ten seconds of Grateful Dead audio (specifically 10 seconds of Sugar Magnolia from 16th April 1978:
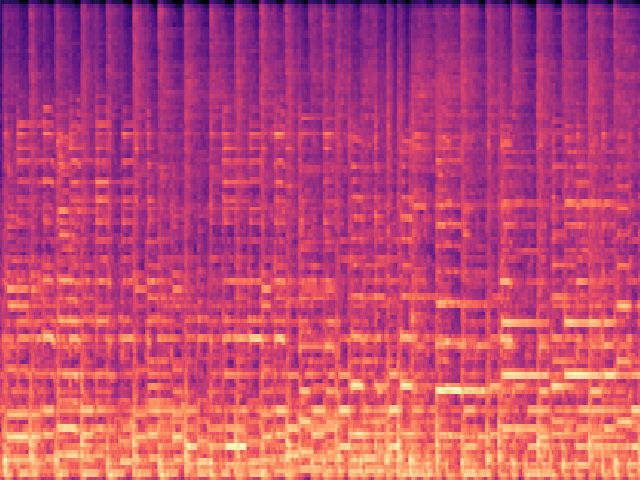
You can kinda see a beat as the vertical lines on the Mel.
Plans For The Future
So the plan is pretty simple:
- Go and grab a load of audio
- Slice it into ten second files
- Generate a Mel image for each slice
- Train the discriminator on these images
- Train the creator against the discriminator
- Take the image output of the creator and turn it into sound
And the, voila! we have created something that hopefully sounds like the Grateful Dead. Stick around to see what results we get!

